Below are a couple of charts that examine trends the Charleston housing market. These charts don’t change that much though on a short term basis. It’s interesting to look at the changes that we have seen though since April 2022.
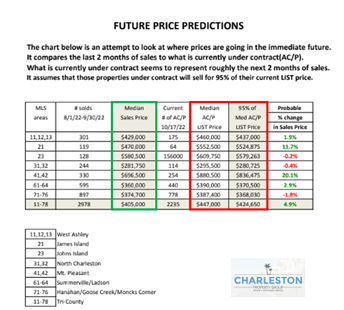
The first chart below is the future price prediction chart. Many people are wondering if prices are going to fall in the “new” market. Our future price prediction chart however is more of a short term predictor. It compares the last two months of closed sales with what’s currently under contract. What’s under contract should make up a lot of sales over the coming two months. We normally expect the contingents to close for about 95% of their list price on average. We expect to see much more red on this chart in January and April of 2022. It takes a little while for this big of a change in the market to show up in the stats. It’s really a bit early to try to find this market change in the stats.
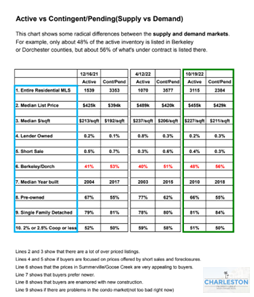
The other chart below is the active versus contingent chart. It’s a comparison of those two markets over a range of different stats. Understanding of course that the houses that are under contract (contingent) come from what were actives. So, these two baskets should look similar, all things being equal. But all things aren’t always equal. If you see a difference in a stat here, it speaks to something. What that something is depends on an educated guess. For instance, the median year built of active inventory is 2010. However, the median year built of the contingent/pending category is 2018. This clearly shows that buyers are more interested in newer listings. Also note that the active median is much higher than the active median was in April. We think this shows that there are a lot more new construction listings now than in April. New construction is difficult for stats because they don’t always list all they have. All we can do is assume that they are not reporting on about the same level they’ve always been. You will note on this chart that active inventory has almost tripled since April. The number of homes under contract is drastically down versus April. Also note that the active list price is down since April. That may be the stat everyone is looking for.